Beyond Vanity Metrics: Instagram Analytics That Actually Matter

Do Instagram analytics have you confused? It’s important to understand what matters when it comes to measuring your brand’s success on Instagram, but the good news is, it’s also ultra easy.
Today, I am sharing a basic, beginner’s guide to understanding Instagram analytics. Yes, you can certainly dive deeper, but everything you really, really need to understand about Instagram performance is actually pretty simple and straightforward.
This is going to be VERY EASY. We are going to open the Instagram app, head to insights, and in just a few minutes, we are going to dig into the top three categories of Instagram Insights: Content, Activity, and Audience. Let’s do this!
Get started with Instagram Analytics in the App
Start by tapping on the hamburger menu icon in the top right corner of your Instagram profile, and then click on “Insights” tab, which will open the analytics for your business profile. (You do need to have a business profile to access all of the insights I’ll be covering today.)
Now, you’ll see three main categories at the top of your screen: Content, Activity, and Audience. You can dig into these categroies to explore how content is performing, who your audience is (age, location, sex, etc.), as well as taking a peek at your overall activity including reach, impressions, profile visits, website clicks and more.
WHAT MATTERS: EVALUATING HOW YOUR POSTS ARE REALLY PERFORMING BY CALCULATING ENGAGEMENT RATE.
Let’s start by going to the Insights -> Content tab to determine the engagement rate of your content. This is hands down one of the most important Instagram Metrics.
Engagement rate is crucial BUT but be weary of just looking at how many likes a post gets. You need to focus on Engagement Rate, how many people engaged with your post divided by the number of people it actually reached.
For 2019 Rival IG reports that the average industry engagement rate is 1.6% thanks to recent algorithm changes. Above 1.6% is above average, industry wide.
Here’s the simple formula for getting your engagement rate: Take the total number of engagements (likes, comments, saves and shares) and divide it by the total reach for that post, then multiply by 100%.
For example: If your last post received 100 engagements and 1000 reach the formula is (100/1000) x 100% = 10% engagement rate. Got it?
So, for the example post below from my feed, we have 467 likes as of time of writing, 47 comments, 1 share and 6 saves for a total of 521 divided by a reach of 6,949. That’s an engagement rate of 7.49%. This is an excellent engagement rate and one of my more engaging recent posts. Not every post is a winner, but the goal is to look at those that are and try to create more of the same.
What Matters: Instagram ACTIVITY INCLUDING Reach, Profile Views and Clicks or other actions.
When you head to Insights -> Activity you’ll see a breakdown of discovery, reach, impressions and interactions for your Instagram account.
One of the most useful ways to utilize Instagram to grow your brand is to reach new people. That’s what I encourage you to look at Insights -> Activity -> Discovery as an important Instagram metric, more so than just looking at likes.
Discovery metrics include the following:
Home – People who saw the post from their feed
Search & Explore – People who searched for keywords or saw your post on an Explore feed
Profile – People who found your post from your profile page
Location – People who viewed your post from a location feed
Hashtags – People who discovered your post via a hashtag search
Other – Posts shared via direct message, posts that were saved, posts you’re tagged or mentioned in, post notifications where you were tagged or mentioned, and posts that show up on the Following tab in Notifications
While likes ( or <3s) and impressions may seem important, they aren’t the top metrics I want you to focus on. Impressions represent the total number of times your photo, video, or story has been seen. Instagram Reach matters more because it is a measure of every single account that views your photo, video, or story.
Impressions are counted every time content is viewed while reach is counted once per unique user. Make sense?
Now, scroll down to Profile Visits, Website Clicks, etc. This may be one of your most important Instagram Metrics depending on your business type. How many people are looking at your profile and clicking through to your website? For many businesses, that’s a metric that matters!
What Matters: Finding out who your followers are so you can understand what’s important to them.
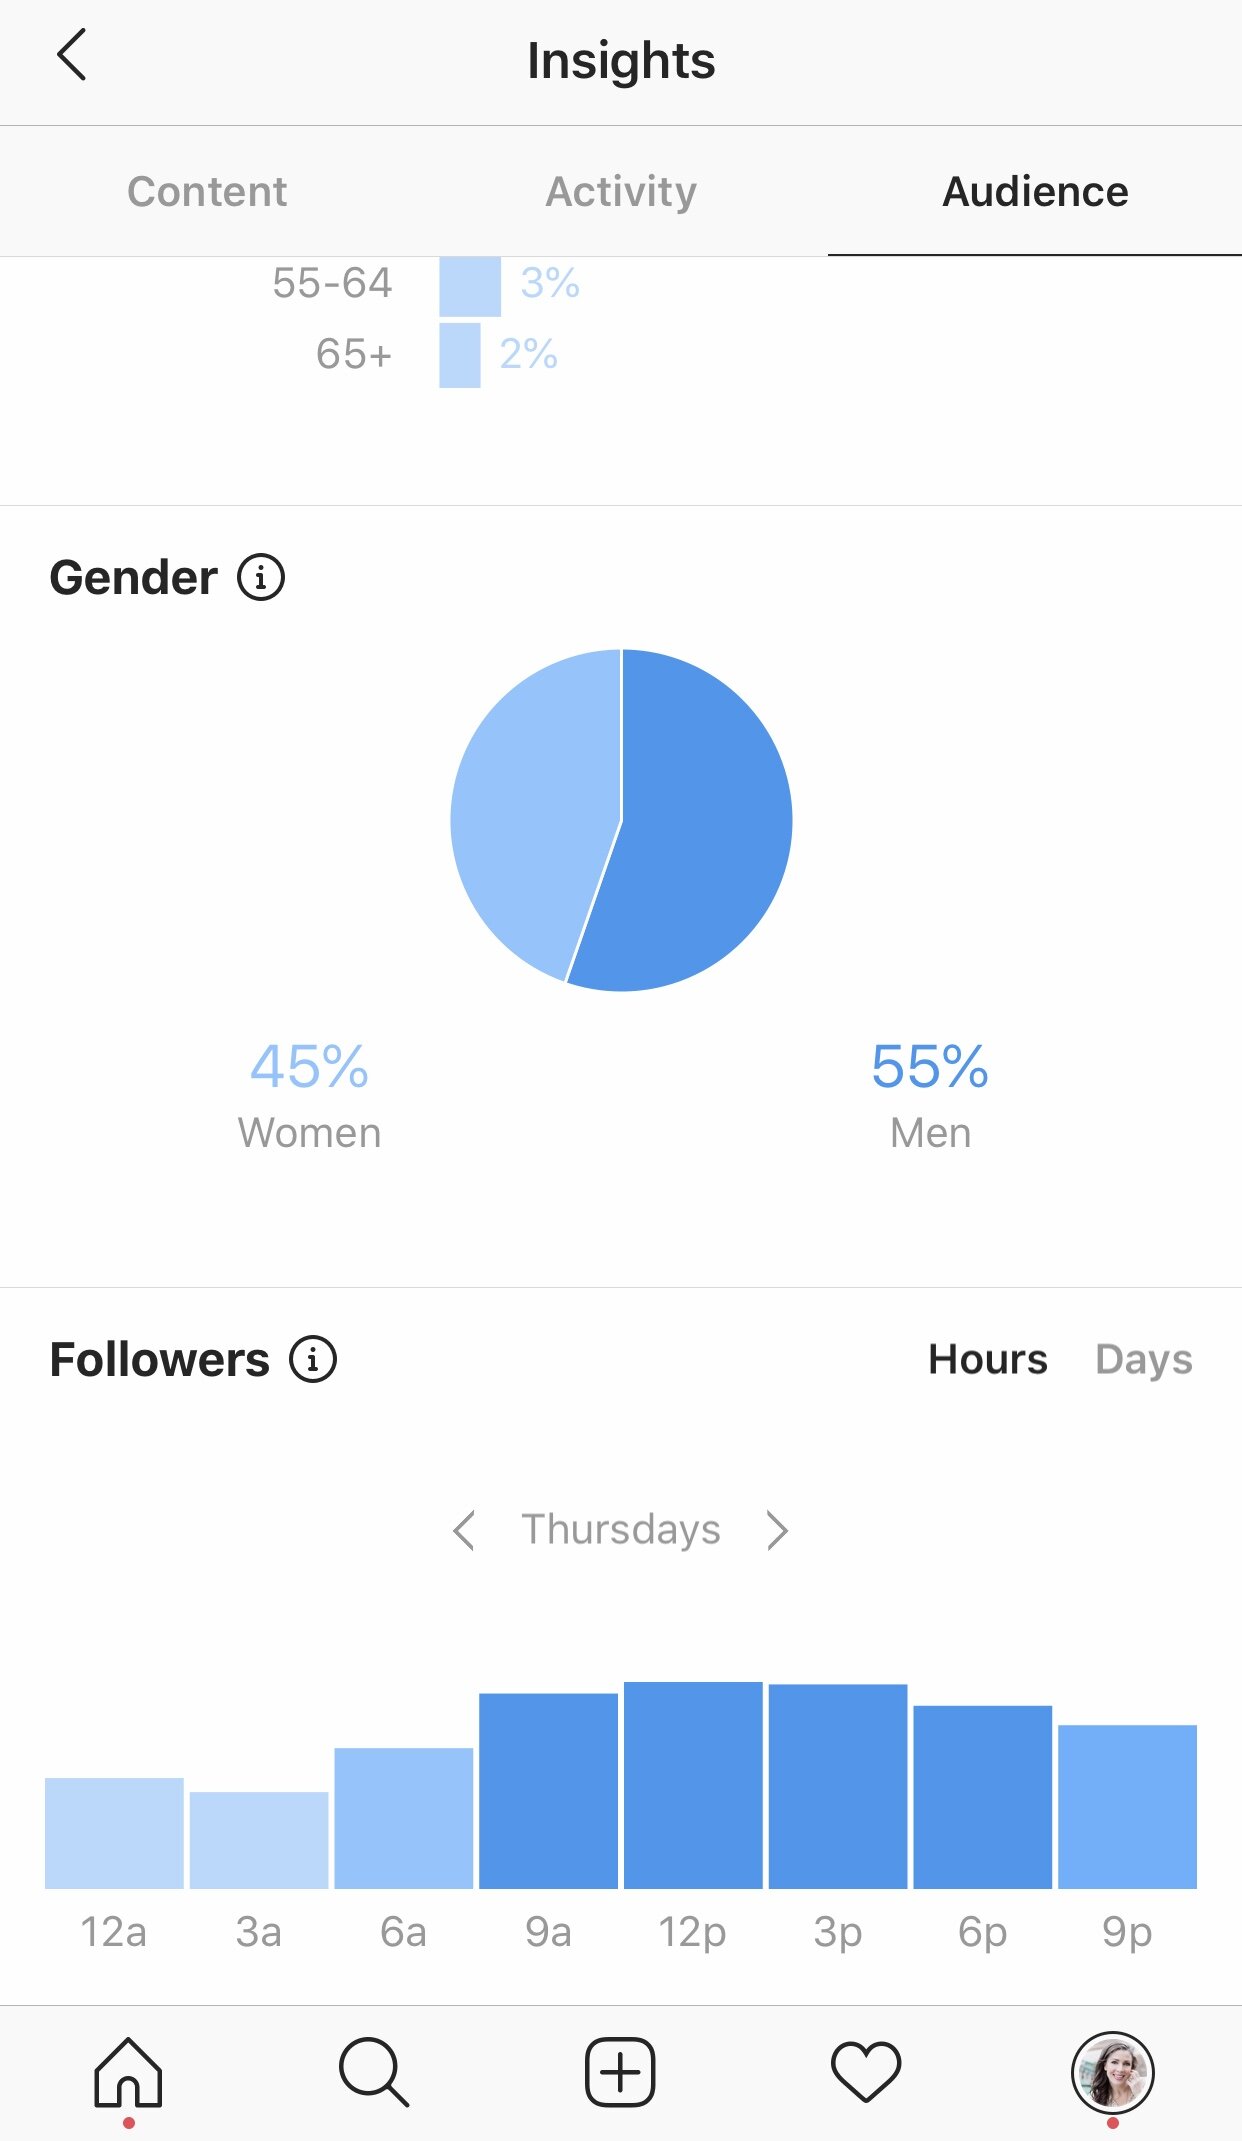
Let’s go to Insights -> Audience which is where Instagram offers basic demographic information about your current audience, including gender and age breakdowns, as well as locations.
You can disocver where your audience lives, what percentage are men or women, and a follower breakdown by sex and age. You’ll also find a basic overview of when (which day and at what time) your followers are on Instagram so that you can post content on the days/times that your followers are most likely to see your posts.
You don’t have to go crazy looking at this section of your Instagram Insights. Check it out, get a good grasp on who your audience is, and then check back in once a month to see if there have been any major shifts in these numbers. Done and done.
Have questions? Ideas! Did I miss something? Let’s talk. Chime in via the comments section below or, of course, head over to Instagram and connect with me there.


